Further information
Past performance may not be repeated and fees and costs may change in future financial years.
The fees, costs and taxes have been based on a member who has an account balance of $50,000. Each year is a financial year (1 July to 30 June).
# Rest has set an investment return objective for the Core Strategy of CPI + 3% per annum over rolling ten year periods. The objective forms the basis from which the Trustee sets an investment strategy and monitors investment performance. The Return Target shown in this Product Dashboard is different from that objective and is calculated in accordance with the requirements that apply to a Product Dashboard. The Return Target is the mean annualised estimate of return over ten years above CPI, after deducting investment and administration fees, costs and taxes. These estimates and assumptions may change over time. It is not a guaranteed return.
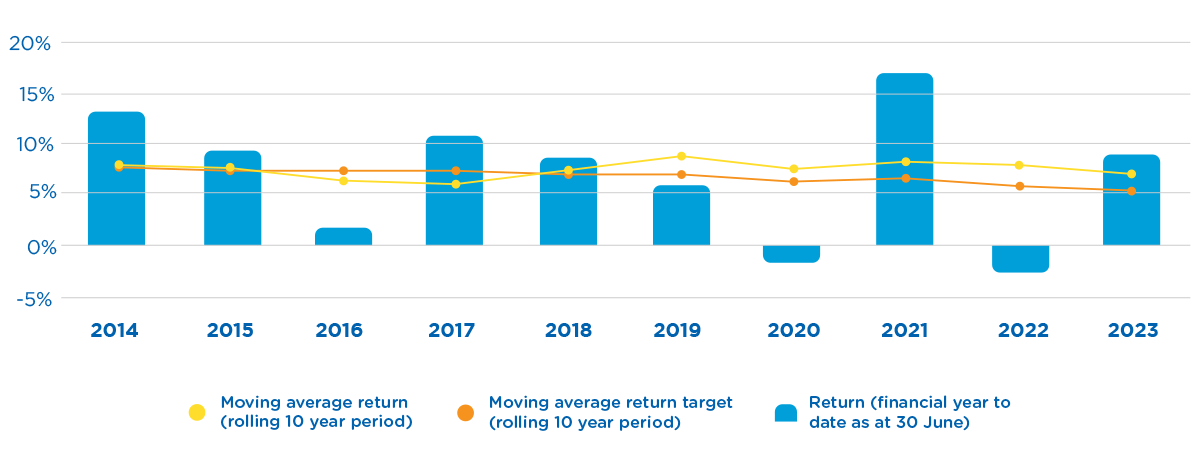
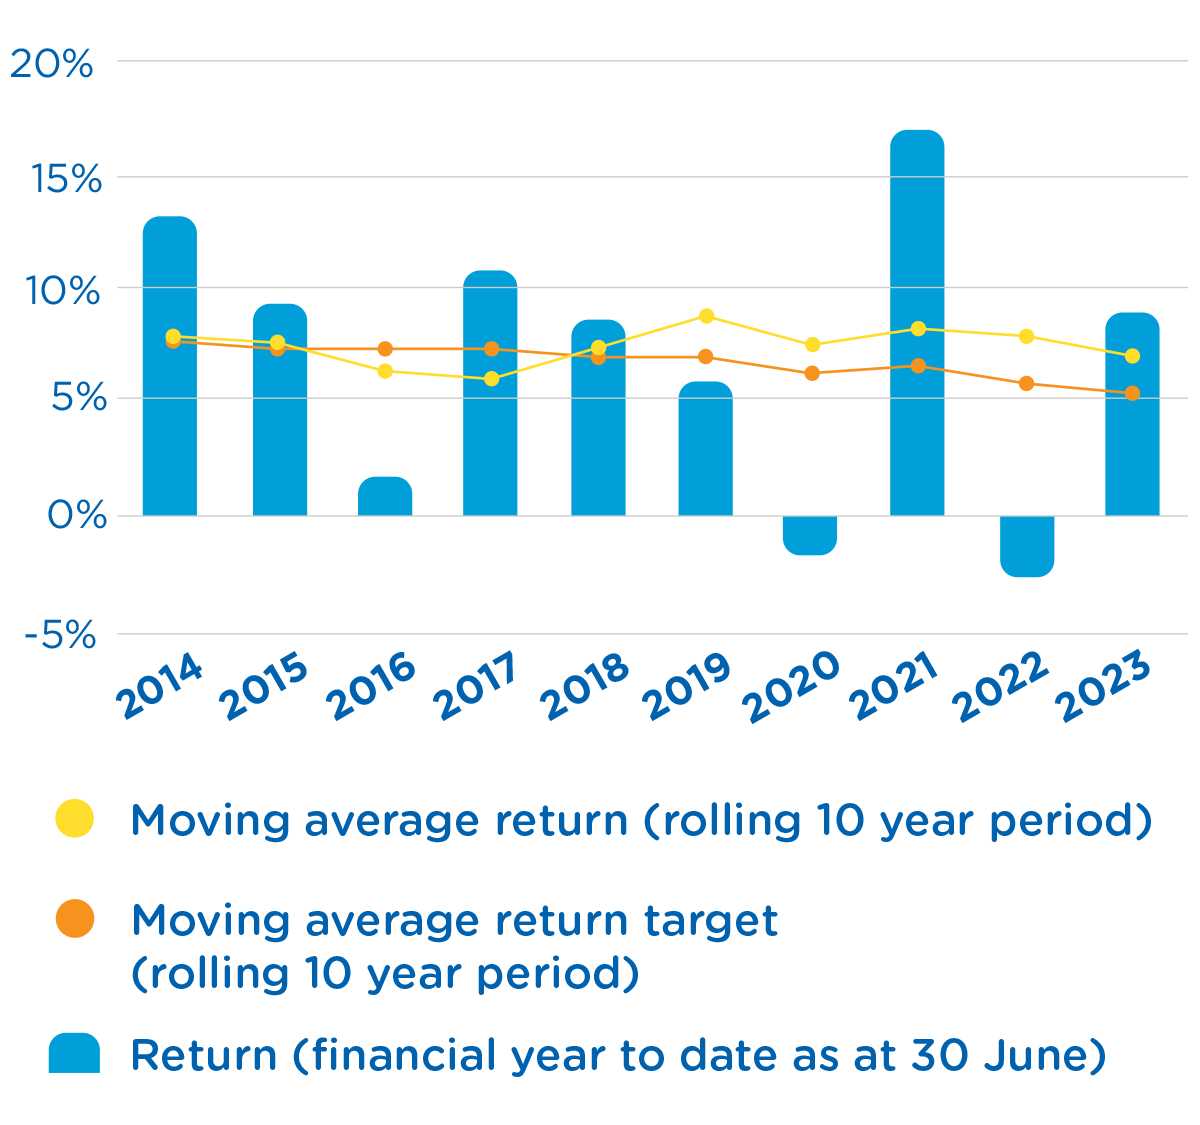
* The graph shows a comparison between the return, moving average return (rolling 10 year period) and moving average return target (rolling 10 year period) to 30 June. The return is calculated after deducting investment and administration fees, costs and taxes.
† This is a guide as to the likely number of negative annual returns expected over any 20 year period (also referred to as the Standard Risk Measure). The Standard Risk Measure is not a complete assessment of all forms of investment risk, for instance it does not detail what the size of negative return could be or the potential for a positive return to be less than a member may require to meet their objectives. Further, it does not take into account the impact of administration fees and tax on the likelihood of a negative return. Members should still ensure they are comfortable with the risks and potential losses associated with their chosen investment option(s).
^ You will be charged an administration fee of $1.50 per week ($78 pa) regardless of your balance, plus 0.10% pa of your balance at the end of each month ($50 pa), plus investment fees and costs of 0.48% pa (including a performance fee of 0.06% pa) ( $240 pa), and transaction costs of 0.07% pa ($35 pa), bringing the total cost to $403 per year. The investment fees and costs and transaction costs are an estimate based on the financial year to 30 June 2023. The performance fees included in investment fees and costs are an average of the performance fees incurred in the previous 5 financial years.
Last updated 9 August 2023.